snps&GO
 
cornerL
home
benchmark
help
contact
cornerR


SNPs&GO
Predicting disease associated variations using GO terms


Introduction
The genetic basis of human variability is mainly due to Single Nucleotide Polymorphisms (SNPs). The most investigated SNPs are missense mutations resulting in residue substitutions in the protein. Here we present SNPs&GO and SNPs&GO3d that collect in an unique framework information derived from protein sequence, 3D structure, protein sequence profile, and protein function. The enormous number of human SNPs available in the data bases poses the question of relating protein variations to diseases. We propose a new server that uses different pieces of information, including that derived from the Gene Ontology annotation to predict if a given variation can be classified disease-related or neutral.


Methods
For the first time we present a GO-integrated predictor tested and trained with a stringent cross-validation procedure. SNPs&GO is a SVM-based classifier [1] consisting of a single SVM that takes in input protein sequence, profile and functional information (see figure below).
The SNPs&GO input is build according to the following steps:

  • for a given mutation the substitution from the wild-type residue to the mutant is encoded in a 20 elects vector that have -1 in the position relative to the wild-type residue, 1 in the position relative to the mutant residues and 0 in the remaining 18 positions.

  • a second 20 elements vector encoding for the sequence environment is build reporting the occurrence of the residues in a window of 19 residues around the mutated residue (Seq).

  • For a given protein, its sequence profile features (Prof) are extracted from a BLAST search output [2]. From the output we evaluate both both the frequency of the wild type (Fi(WT)) and mutated (Fi(MUT)) residues at position i. NAL is the number of sequences in the alignment at a given position and the CI is the Conservation Index

  • We consider in the input vector, four outputs of the PANTHER algorithm [3]: the predicted probability of deleterious mutation, the frequencies of the wild-type and mutated residue and the number of independent counts (NIC)

  • The input is composed by the sum of log-odd scores for all the GO terms associated to the protein under consideration and their parents and the number of all the GO terms associated to the protein undergoing variation (LGO).

The server also implements PhD-SNP method that take in input different subsets of SNPs&GO's input features. The PhD-SNP method takes in input the first 45 elements vector encoding for the sequence and profile information. Selecting the option "All methods" the prediction of PhD-SNP is calculated and included in the output.

SNPs&GO3d is based a SVM-based classifier [4] based on a single SVM that takes in input protein 3D structure, profile and functional information (see figure below).
The SNPs&GO3d input is build following the next steps:

  • for a given mutation the substitution form the wild-type residue to the mutant is encoded in a 20 elemts vector that have -1 in the position relative to the wild-type residue, 1 in the position relative to the mutatnt residues and 0 in the remaining 18 positions.

  • a second 20 elements vector encoding for the structural environment is build reporting the occurrence of the residues in a radius shell of 6 Ang around the C-alpha of the mutated residue (3D). One element encoding for the Relative Solvent Accessible area (RSA) of the mutated residue is calculated using DSSP algorithm [5].

  • For a given protein, its sequence profile features (Prof) are extracted from a BLAST search output [2]. From the output we evaluate both the frequency of the wild type (Fi(WT)) and mutated (Fi(MUT)) residues at position i. The NAL is the numeber is the number of sequences in the alignment at a given and position and the Conservation Index (CI).

  • We consider in the input vector, four outputs of the PANTHER algorithm [2]: the predicted probability of deleterious mutation, the frequencies of the wild-type and mutated residue and the number of independent counts (NIC)

  • The input is composed by the sum of log-odd scores for all the GO terms associated to the protein under and their parents and the number of all the GO terms associated to the protein under mutation (LGO).

The server also implements S3D-PROF method that take in input different subsets of SNPs&GO3d's input features. The S3D-PROD method takes in input the first 46 
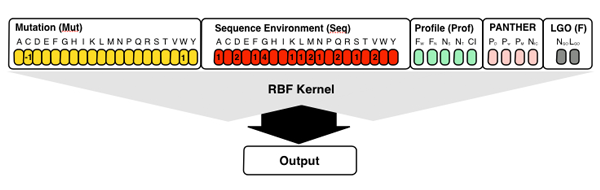
elements vector encoding for the structure and profile information. Selecting the option "All methods" the predictions of S3D-PROF and standard sequence-based SNPs&GO are calculated and included in the output.

Results
SNPs&GO was trained on a set of 38460 mutations and tested with a cross-validation procedure over sets in which similar proteins were kept in the same dataset also for the calculation of the LGO score, as derived from the GO data base. At increasing input level of complexity, the performance is also increasing, suggesting that on top of sequence profile also LGO, derived from the protein GO annotation, is a crucial added value for discriminating disease-related polymorphisms from neutral ones. The finding that the level of performance increases at increasing information added to the input corroborates the notion that support vector machines can capture all the correlations existing in complementary knowledge. Recently SNPs&GO was also tested by another laboratory and scored among the best predictors available [6]. The benchmark that we performed in house indicates that presently SNPs&GO is one of the best scoring classifiers available for predicting whether a mutation at the protein level is or is not disease-related. Recently, SNPs&GO and SNPs&GO3d have been tested on a dataset of 1,489 variants from 271 proteins with known structures (SAP-NEW). Predictions have been obtained removing from the training set all the variants from proteins with sequence identity higher than 80% over more than 80% of the protein. The efficiency of SNPs&GO and SNPs&GO3d on SAP-NEW are compared with those of PhD-SNP and and S3D-PROF methods.


Methods
Q2
P(D)
Q(D)
P(N)
Q(N)
MCC
AUC

PhD-SNP
0.70
0.77
0.75
0.57
0.61
0.35
0.74
S3D-PROF
0.74
0.77
0.84
0.65
0.55
0.41
0.78
SNPs&GO
0.79
0.84
0.83
0.71
0.71
0.54
0.85
SNPs&GO3d
0.84
0.84
0.89
0.85
0.78
0.68
0.91


The overall accuracy Q2 is:

Q2=p/N


where p is the total number of correctly predicted residues and N is the total number of residues.
The correlation coefficient MCC is defined as:

C(s)=[p(s)n(s)-u(s)o(s)] / W


where W is the normalization factor

W=[(p(s)+u(s))(p(s)+o(s))(n(s)+u(s))(n(s)+o(s))]1/2


for each class s (D and N, for disease-related and neutral polymorphism, respectively); p(s) and n(s) are the total number of correct predictions and correctly rejected assignments, respectively, and u(s) and o(s) are the numbers of under and over predictions.

The coverage for each discriminated structure s is evaluated as:

Q(s)=p(s)/[p(s)+u(s)]


where p(s) and u(s) are as defined above. The probability of correct predictions P(s) (or accuracy for s) is computed as:

P(s)=p(s) / [p(s) + o(s)]


where p(s) and o(s) are defined above (ranging from 1 to 0).


References

[1] Calabrese R, Capriotti E, Fariselli P, Martelli PL, Casadio R. (2009). Functional annotations improve the predictive score of human disease-related mutations in proteins. Human Mutation. 30;1237-1244.
[2] Altschul SF, Madden TL, Schaffer AA, Zhang J, Zhang Z, Miller W, Lipman DJ. (1997) Gapped BLAST and PSI-BLAST: a new generation of protein database search programs. Nucleic Acids Res., 25, 3389-3402.
[3] Thomas, P.D. and Kejariwal, A. (2004) Coding single-nucleotide polymorphisms associated with complex vs. Mendelian disease: evolutionary evidence for differences in molecular effects. Proc Natl Acad Sci U S A. 101:15398-15403.
[4] Capriotti E, Altman RB. (2011). Improving the prediction of disease-related variants using protein three-dimensional structure. BMC Bioinformatics. 12 (Suppl 4): S3.
[5] Kabsch, W. and Sander, C. (1983) Dictionary of protein secondary structure: pattern recognition of hydrogen-bonded and geometrical features. Biopolymers. 22: 2577-2637.
[6] Thusberg, J., Olatubosun, A. and Vihinen, M. (2011) Performance of mutation pathogenicity prediction methods on missense variants. Human Mutation., 32, 358-368.


cornerL
cornerR