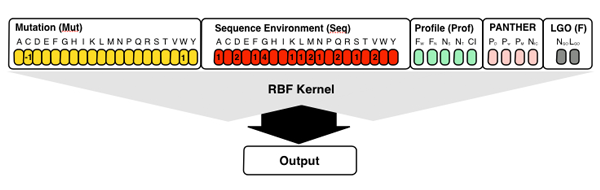
The server also implements SEQ-PROF and SVM-GOS methods that take in input different subsets of SNPs&GO's
input features. The SEQ-PROD method takes in input the first 45 elements vector encoding for the sequence and profile information and SVM-GOS a two element vector encoding for the functional information. Selecting the option "All methods" the prediction of SEQ-PROF
and SVM-GOS are calculated and included in the output.
Results
SNPs&GO was trained on a set of 38460 mutations and tested with cross-validation procedure over sets in which similar proteins were kept in the same dataset also for the calculation of the LGO score, as derived from the GO data base. At increasing input level of complexity, the performance is also increasing, suggesting that on top of sequence profile also LGO, derived from the protein GO annotation, is a crucial added value for discriminating disease-related polymorphisms from neutral ones. The finding that the level of performance increases at increasing information added to the input corroborates the notion that support vector machines can capture all the correlations existing in complementary knowledge.
Recently SNPs&GO was also tested by another laboratories and scored among the best predictor available [3].
The benchmark that we performed in house indicates that presently SNPs&GO is one of the best scoring classifiers
available for predicting whether a mutation at the protein level is or is not disease-related.
In the table the efficiency of SNPs&GO is compared with those obtained by SEQ-PROF and a simple GO-based method.
|
Methods
|
Q2 |
P(D) |
Q(D) |
P(N) |
Q(N) |
C |
|
SEQ-PROF |
0.76 |
0.76 |
0.77 |
0.76 |
0.76 |
0.52 |
SVM-GOS |
0.70 |
0.73 |
0.62 |
0.67 |
0.77 |
0.40 |
SNPs&GO |
0.81 |
0.81 |
0.82 |
0.82 |
0.81 |
0.63 |
|
The overall accuracy Q2 is:
Q2=p/N
where p is the total number of correctly predicted residues and N is the total number of residues.
The correlation coefficient C is defined as:
C(s)=[p(s)n(s)-u(s)o(s)] / D
where D is the normalization factor
D=[(p(s)+u(s))(p(s)+o(s))(n(s)+u(s))(n(s)+o(s))]1/2
for each class s (D and N, for disease-related and neutral polymorphism, respectively); p(s) and n(s) are the total number of correct predictions and correctly rejected assignments, respectively, and u(s) and o(s) are the numbers of under and over predictions.
The coverage for each discriminated structure s is evaluated as:
Q(s)=p(s)/[p(s)+u(s)]
where p(s) and u(s) are as defined above. The probability of correct predictions P(s) (or accuracy for s) is computed as:
P(s)=p(s) / [p(s) + o(s)]
where p(s) and o(s) are defined above (ranging from 1 to 0).
References
[1] Calabrese R, Capriotti E, Fariselli P, Martelli PL, Casadio R. (2009). Functional annotations improve the predictive score of human disease-related mutations in proteins. Human Mutation. 30; 1237-1244.
[2] Altschul SF, Madden TL, Schaffer AA, Zhang J, Zhang Z, Miller W, Lipman DJ. (1997) Gapped BLAST and PSI-BLAST: a new generation of protein database search programs. Nucleic Acids Res., 25, 3389-3402.
[3] Thusberg, J., Olatubosun, A. and Vihinen, M. (2011) Performance of mutation pathogenicity prediction methods on missense variants. Human Mutation., 32, 358-368.